|
We utilizes CLAUDS+HSC deep imaging data to study environmental effect on galaxy evolution. Environmental effect plays an important role in formation and evolution of galaxies, especially in dense regions like in galaxy clusters. We chose to study satellite galaxies because they are good indicators to reflect on environmental effect on galaxy evolution. Thanks to deep imaging data, we were able to investigate satellite galaxies in detail. In my thesis project, we wish to answer these questions: How do satellite galaxies distribute in clusters? Why do they have such distribution? How does such distribution evolve? To answer these questions, we used deep imaging data in HSC and CLAUDS covering 20 deg^2 in several legacy fields. HSC has 5 band photometry (g,r,i,z,y) and a typical depth in i band about 27 mag/arcsec^2, and CLAUDS is a U-band complementary to HSC deep fields, and it has the deepest U-band imaging to date. Stellar masses and photometric redshifts (photoz) were estimated from the dataset. We chose to perform analysis on objects that are within 0.3<z<0.9, where we have good estimation on masses and photoz’s. From the dataset, we first selected massive galaxies in our sample, which are the most likely to be central galaxies in cluster/group systems. We also checked that most of our potential cluster systems do have a clear red sequence, indicating that they are real clusters. Our satellite galaxy sample were selected by cylindrical shape selection spatially and was cut at M>9.5 due to incompleteness below this mass limit. A cylindrically-shaped spatial selection: a circular aperture on the sky and on radial direction, we choose to use 1.5 times uncertainty of photometric redshift to distinguish cluster members. 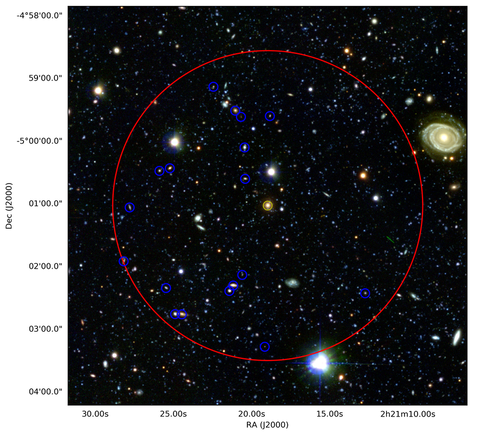 Fig.1 An example of potential satellite galaxy selection. We measured radial number density profiles of satellites, as a function of projected radius to central galaxy. We then stack profiles to achieve an averaged typical profile. Fig.2 shows three averaged profiles at z~0.4, z~0.6 and z~0.8. We fitted projected NFW profiles to those profiles and found out that the slope of profile is steeper than NFW within 100 kpc radius from the central galaxies, i.e. we found excess over NFW profile in inner regions around central galaxies. This is particularly interesting and may be related to how satellite galaxies interact with each other and the host dark matter halo. After construction of the central and satellite sample, we stacked satellite galaxy systems around each central galaxy to achieve significant statistical sample to find the average number density profiles at different redshifts. We found that they cannot be described by NFW profile in inner regions of group/cluster environment, instead showing an excess over NFW profile there (within ~100kpc). We saw that across the redshift range that we observed, the shape of profile is preserved. We then split our central galaxy sample into star-forming and quiescent subsamples and found that satellite quiescent fraction is higher around quiescent centrals, while the fraction is close to field value around star-forming centrals. This is a confirmation of galactic conformity. We also split our satellite galaxy sample in to low-mass and high-mass ones and found that the two-bump shape profile is seen in both populations. Characteristic radius of NFW profiles are different for low-mass and high mass satellites. These findings are consistent with general cluster dynamics. 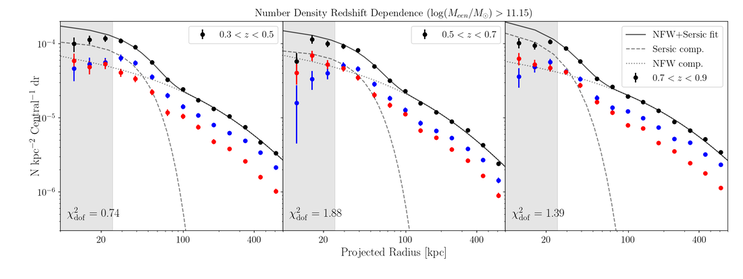 Fig.2 Radial Number Density Profiles of satellite galaxies. Black dots show total sample, red and blue dots show quiescent and star-forming population respectively. We split our central galaxy sample into star-forming ones and quiescent ones, and repeat radial number density measurement of satellites around two samples respectively. Result is shown in figure.3, in which we confirmed of galaxy conformity previously found in SDSS data. 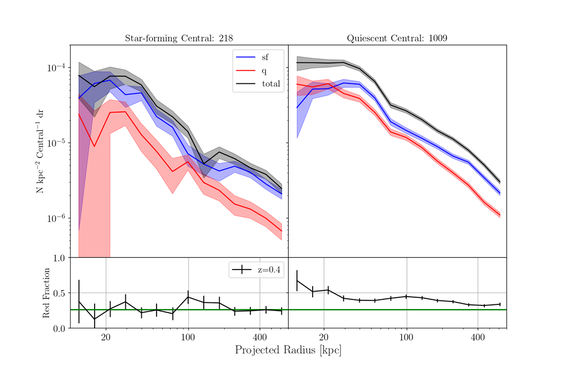 Left panel: satellite number density profile with quiescent centrals. Right panel: same with star-forming centrals From these analyses, we are able to formulate our (partial) answer for the first question in the beginning of this summary. To answer the first question, we found that number density of satellite galaxies in clusters typically have a two-component shape radial distribution, larger scale of which can be described by NFW profile. For second question, our explanation for two-bump shape of the satellite number density profile is that when satellite galaxies fall in galaxy clusters with their associated dark matter halo, they were slowed down, but close to central galaxy, they started to feel less drag (may be due to gas/halo already stripped), thus started to pile up. Galaxy merging timescale is longer than expected for satellites close to the central galaxy.
There are some known caveats in our research. are subsamples matched? We become incomplete within ~20kpc. We cannot confirm accurate membership. We assumed that most massive galaxy is at cluster core and is central galaxy. We will solve some of them by improving our analysis method and sample selection. We wish to answer third question in next stage, which is to give an explanation to satellite number density profiles and to find whether these profiles evolve through cosmic time. We will also compare observation with simulation results to validate our arguments on evolution of the profiles.
0 Comments
|
 RSS Feed
